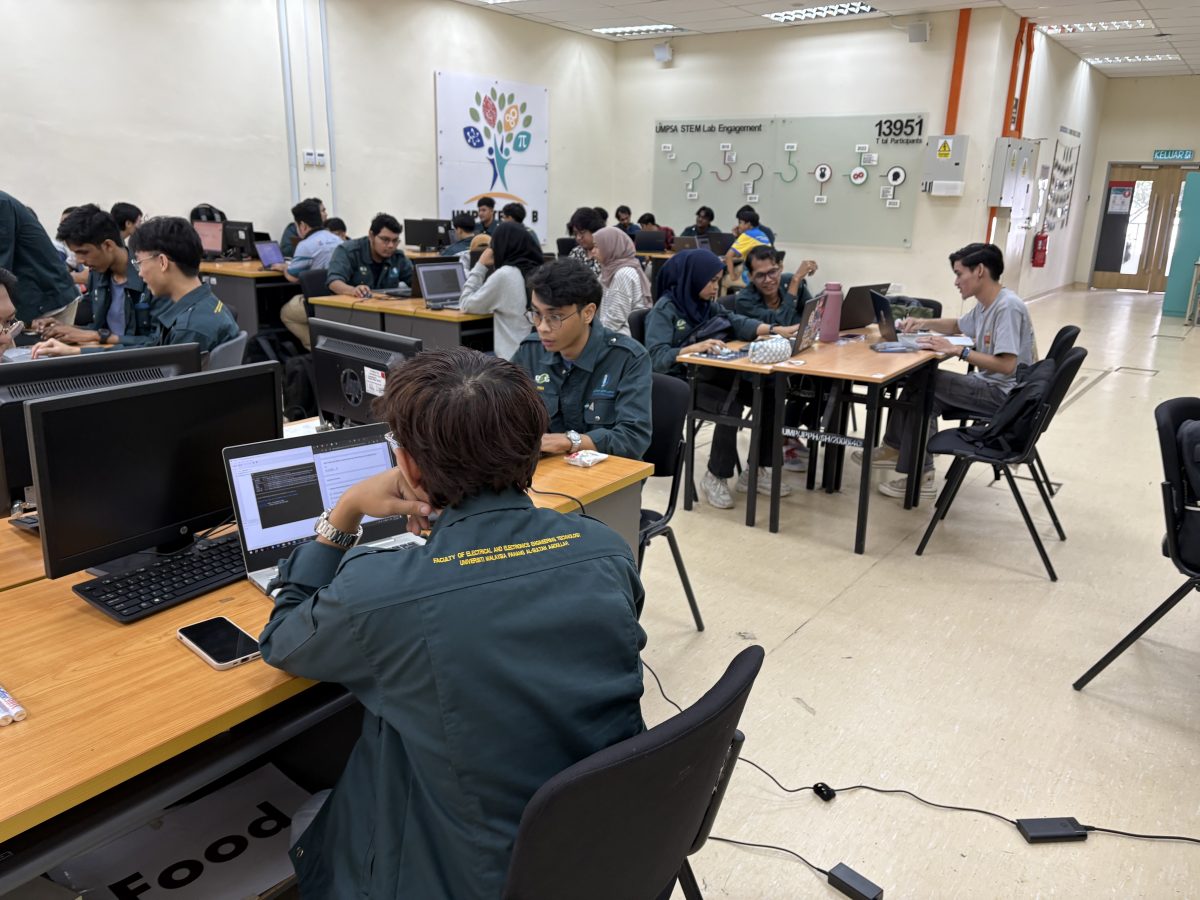
UMPSA STEM Lab Dashboard Design Workshop
UMPSA STEM Lab Dashboard Design Workshop involving 76 students -(21 BTech, 37 BTE BTS, 26 Diploma)
In this session, students transitioned from data collection to data visualization by learning how to design and develop dashboards using Python and Streamlit. The hands-on activities included:
1. Importing and handling data from various sources (e.g., APIs, Google Sheets, local files)
2. Creating interactive dashboards with text, metrics, and widgets
3. Visualizing data with charts and graphs
4. Deploying dashboards online for real-time accessibility
This workshop equipped students with the skills to present and interpret data effectively, enhancing their understanding of how technology can solve real-world problems.


